A Single Curve, Reconciled from Five Studies
Ask five studies for the click-through rate (CTR) of Google's number-one organic result and you will get five different answers, ranging from roughly 8% to nearly 40%. None of them is wrong. They are measuring different mixes of search results pages, different devices, different time periods, and different samples. The problem for anyone who needs a number — for a forecast, a pitch, or a benchmark — is that the spread is enormous.
This page does two things. First, it presents a composite curve: a single defensible central estimate for each position on a typical organic SERP, derived by reconciling the five studies below. Second, it keeps the full range visible alongside each composite figure, so the uncertainty is never hidden inside a tidy average. The chart and the table are released under a Creative Commons licence; the embed snippet near the bottom lets you place them on your own pages.
The five sources reconciled here are:
- First Page Sage (2026) — the highest figures, reflecting cleaner organic SERPs.
- Backlinko — 4 million keywords; the most widely cited general benchmark.
- SISTRIX — 80 million keywords; the most granular by SERP type.
- GrowthSRC (2025) — 200,000 keywords from Search Console; best for year-over-year trend.
- seoClarity — 750 billion impressions; the largest and most conservative, all-inclusive figures.
For positions 1–10, the composite estimate is a reconciled central value that favours the cluster of clean-organic studies (Backlinko and SISTRIX) while treating the high outlier (First Page Sage) and the all-SERP-types low outlier (seoClarity desktop) as the edges of the range, not the centre. It is an editorial estimate, not a weighted statistical mean — the underlying studies use incompatible methodologies and cannot be pooled mathematically. The per-study source numbers are shown in full in the five-study table so you can build your own composite if you prefer different weights.
The Composite CTR Curve
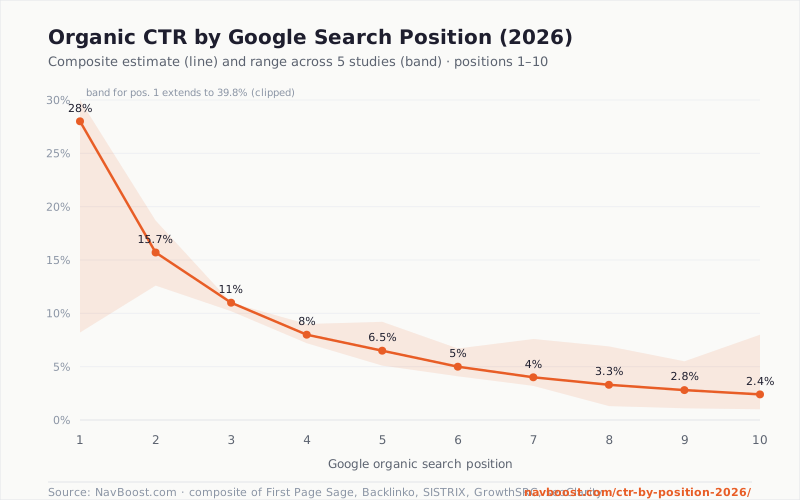
The line is the composite estimate; the shaded band is the full low-to-high range across all five studies. The steepest drop — the position-1-to-2 cliff — is visible immediately.
Composite CTR-by-Position Table (Positions 1–10)
This is the headline dataset: one composite estimate per position, with the study-derived range beside it. Click any column header to sort.
| Position | Composite CTR (estimate) | Study Range (low–high) | Notes |
|---|---|---|---|
| 1 | 28% | 8.2–39.8% | Widest spread of any position; depends entirely on SERP features |
| 2 | 15.7% | 12.6–18.7% | Steepest drop — the “position-1 cliff” |
| 3 | 11% | 10.2–11.0% | Tightest agreement across studies |
| 4 | 8% | 7.2–9.0% | First Page Sage figures here are interpolated |
| 5 | 6.5% | 5.1–9.2% | Backlinko reports an anomalous 9.21% (layout effect) |
| 6 | 5% | 4.1–6.7% | |
| 7 | 4% | 3.2–7.6% | Backlinko anomaly widens the band |
| 8 | 3.3% | 1.3–6.9% | seoClarity (1.32%) anchors the low end |
| 9 | 2.8% | 1.1–5.5% | |
| 10 | 2.4% | 1.0–8.0% | Backlinko 7.95% reflects the “last result on page 1” effect |
Composite estimates by NavBoost.com. Ranges are the lowest and highest values across First Page Sage (2026), Backlinko, SISTRIX, GrowthSRC (2025), and seoClarity. “Estimate” and “interpolated” figures are labelled where studies report graphical or approximate data. Click headers to sort.
The Five Studies, Side by Side
If you would rather reconcile the data yourself, here is every source figure for positions 1–10. The divergence between First Page Sage (highest) and seoClarity (lowest) is the clearest illustration of why a single “average CTR” is misleading.
| Position | First Page Sage 2026 | Backlinko (4M kw) | SISTRIX (80M kw) | GrowthSRC 2025 (200K) | seoClarity (750B imp.) |
|---|---|---|---|---|---|
| 1 | 39.8% | 27.6% | 28.5% | 19.0% | 8.17% (desktop) |
| 2 | 18.7% | 15.7% | 15.7% | 12.6% | — |
| 3 | 10.2% | 11.0% | 11.0% | — | — |
| 4 | ~7.2% (est) | 8.98% | ~8.0% (est) | — | — |
| 5 | ~5.1% (est) | 9.21% | ~6.5% (est) | — | — |
| 6 | ~4.1% (est) | 6.73% | ~5.0% (est) | — | — |
| 7 | ~3.2% (est) | 7.61% | ~4.0% (est) | — | — |
| 8 | ~2.8% (est) | 6.92% | ~3.5% (est) | — | 1.32% |
| 9 | ~2.4% (est) | 5.52% | ~3.0% (est) | — | 1.10% |
| 10 | ~2.1% (est) | 7.95% | 2.5% | — | 0.98% |
Sources: First Page Sage (2026), Backlinko/Brian Dean (4M results), SISTRIX (80M keywords), GrowthSRC (2025 Search Console study, 200K keywords), seoClarity (750B impressions, desktop). “(est)” marks values approximated from graphical data in the original studies. A dash means the study does not report that position. Full citations in Sources.
For a deeper narrative walk-through of these page-1 figures, the SERP-feature effects behind them, and the page-2 anomaly, see the companion explainer: CTR by Google Search Position: 2026 Benchmarks.
Positions 11–100: Where the Data Runs Out
Beyond page 1, granular data becomes scarce and then effectively non-existent. The figures below are estimates, not measured benchmarks. They are included for completeness and labelled accordingly. Only about 0.63% of searchers click any page-2 result at all, and roughly 75% never scroll past page 1.
| Position / Page | Estimated CTR (per result) | Confidence | Basis |
|---|---|---|---|
| 11–16 (page 2 top) | 0.3–1.0% | Low | seoClarity page-2 data |
| 17–20 (page 2 bottom) | 0.5–1.5% | Low | seoClarity: bottom-of-page-2 effect (17–20 > 11–16) |
| 21–30 (page 3) | 0.1–0.3% | Very low | Extrapolation |
| 31–50 (pages 4–5) | 0.02–0.15% | Very low | Extrapolation |
| 51–100 (pages 6–10) | <0.05% | Negligible | Extrapolation |
Estimates extrapolated from seoClarity page-2 data and Backlinko long-tail analysis. Treat as rough approximations only. The counter-intuitive bottom-of-page-2 effect (positions 17–20 outperforming 11–16) is the one robust finding in this range and is detailed in the companion explainer.
Why the Curve Matters for Click-Based Ranking
The shape of this curve is not just a traffic-forecasting tool. It is also the baseline that Google's click-based re-ranking system, NavBoost, appears to compare observed behaviour against. The leaked 2024 API documentation indicates that click signals are normalised by position through a squashing function — which only works if the system holds an expected-CTR-by-position model very much like the curve above.
That has a practical consequence. A result sitting in position 8 that earns the CTR normally seen at position 3 is sending a stronger-than-expected signal precisely because the expected baseline at position 8 is low. The steepness of the curve is what makes those deviations detectable. For the mechanics of how that expected baseline is modelled, see the CTR curve and expected CTR.
It also explains why the AI-Overview era has not made click signals irrelevant. As zero-click searches climb past 58%, the absolute number of clicks falls — but each remaining click is a more deliberate act, and the ratio NavBoost cares about is between expected and observed clicks, not the raw count.
A note on generating the clicks themselves
Modelling the expected curve is one thing; producing genuine engagement against it is another. Tools that simulate clicks with bots tend to fail the quality checks described in the click-types research. One service that takes the opposite approach is SerpClix, which routes searches through a pool of real human clickers rather than automated traffic — the kind of engagement that resembles what click-based systems are built to measure. It is one option among several, noted here for readers researching execution after the theory.
Embed This Chart or Table
The chart and the composite table are published under a Creative Commons Attribution 4.0 licence. You may republish them on your own site at no cost, provided you keep the visible “Source: NavBoost.com” attribution link. Copy either snippet below.
Option 1: Embed the chart (image)
A single self-contained image with an attribution line beneath it. This is the lightest option — one HTTP request, no script.
Option 2: Embed the composite table (data)
A self-contained HTML table with inline styling, for sites that prefer text-selectable data over an image. Includes the attribution row.
Text citation: NavBoost.com, “Google CTR by Position (2026): What the Data Actually Shows,” composite of First Page Sage, Backlinko, SISTRIX, GrowthSRC, and seoClarity. https://navboost.com/ctr-by-position-2026/
Methodology & Honest Caveats
A composite is only as trustworthy as its disclosure. Four caveats apply to everything above:
- The composite is an editorial estimate, not a statistical mean. The five studies use incompatible methods (keyword samples vs. impression counts, different devices, different regions) and cannot be averaged mathematically without producing a false sense of precision. The composite reflects a reasoned central value; the range is the honest measure of uncertainty.
- SERP features dominate everything. A single number for “position 1” is meaningless without knowing whether the SERP carries an AI Overview, ads, a featured snippet, or sitelinks. Position 1 ranges from 46.9% (sitelinks) to 13.7% (Shopping) by SERP type alone — see the SERP-features breakdown.
- Deep-position figures are extrapolated. Anything beyond position 20 is an estimate with low to negligible confidence, labelled as such throughout.
- CTR is measured on impressions, not searches. A 28% position-1 CTR means 28% of people who saw the result clicked it — not 28% of all searchers. With zero-click rates above 58%, many searches never produce a countable impression-to-click event.
Where a figure is approximate or interpolated, it carries an “(est)” tag or sits inside an explicit range. No speculative number is presented as a measured fact.
Frequently Asked Questions
What is the average organic CTR for position 1 on Google?
There is no single average. Across the five studies reconciled here, position 1 ranges from about 8% (seoClarity, all SERP types, desktop) to 39.8% (First Page Sage, clean organic SERPs). A reasonable composite for a typical organic SERP is around 28%, but the right figure for your case depends on your SERP layout and intent.
Why do the studies disagree so much?
They measure different SERPs. Clean ten-blue-link results push position 1 near 40%; a SERP loaded with an AI Overview, ads, and a knowledge panel pulls it below 15%. Sample type, device, region, and date all add further spread. The composite table keeps every source visible so the disagreement is transparent.
Can I embed the chart or table on my site?
Yes — both are Creative Commons Attribution 4.0. Use either embed snippet above and keep the visible “Source: NavBoost.com” link. No permission or payment is required.
Are the positions 21–100 numbers measured?
No. Almost no granular public data exists past page 2. Those figures are extrapolations from seoClarity's page-2 data and Backlinko's long-tail analysis, and are labelled as estimates with explicit confidence levels.
How often is this updated?
The composite is refreshed when a major new CTR study is published or when Google changes the SERP in a way that materially shifts the curve (as AI Overviews did). The “last updated” date at the top reflects the most recent revision.
Sources
- First Page Sage — Google Click-Through Rates (CTRs) by Ranking Position in 2026. firstpagesage.com
- Backlinko (Brian Dean) — We Analyzed 4 Million Google Search Results. backlinko.com
- SISTRIX — Why (almost) everything you knew about Google CTR is no longer valid & CTRs for various types of Google search result. sistrix.com
- GrowthSRC — Google Organic CTR 2025 (200K keyword study). growthsrc.com
- seoClarity — Mobile & Desktop CTR Study (750B impressions). seoclarity.net
- Semrush — Zero-click search data, 2025 (58.5% US zero-click rate).
For the complete annotated bibliography used across this site, see NavBoost Research Sources.